I got pulled into a new hobby: mesh radio. It’s using the 915MHz ISM band with LoRa. Pretty simple in concept. Small radios act as modems. Apps on phones use BLE to talk to the modem. Messages get repeated by other radios.
There are two main, competing projects. Meshtastic and MeshCore. I think Meshtastic is superior in almost all aspects except for one. It falls over with high density. As a result of that, it lost traction in urban areas like Seattle. So, annoyingly, MeshCore became the de-facto standard around me even though it’s worse in nearly every way.
I started out on this adventure when I bought this thing: https://www.etsy.com/listing/1873027341/nrf-txt-most-advanced-stand-alone
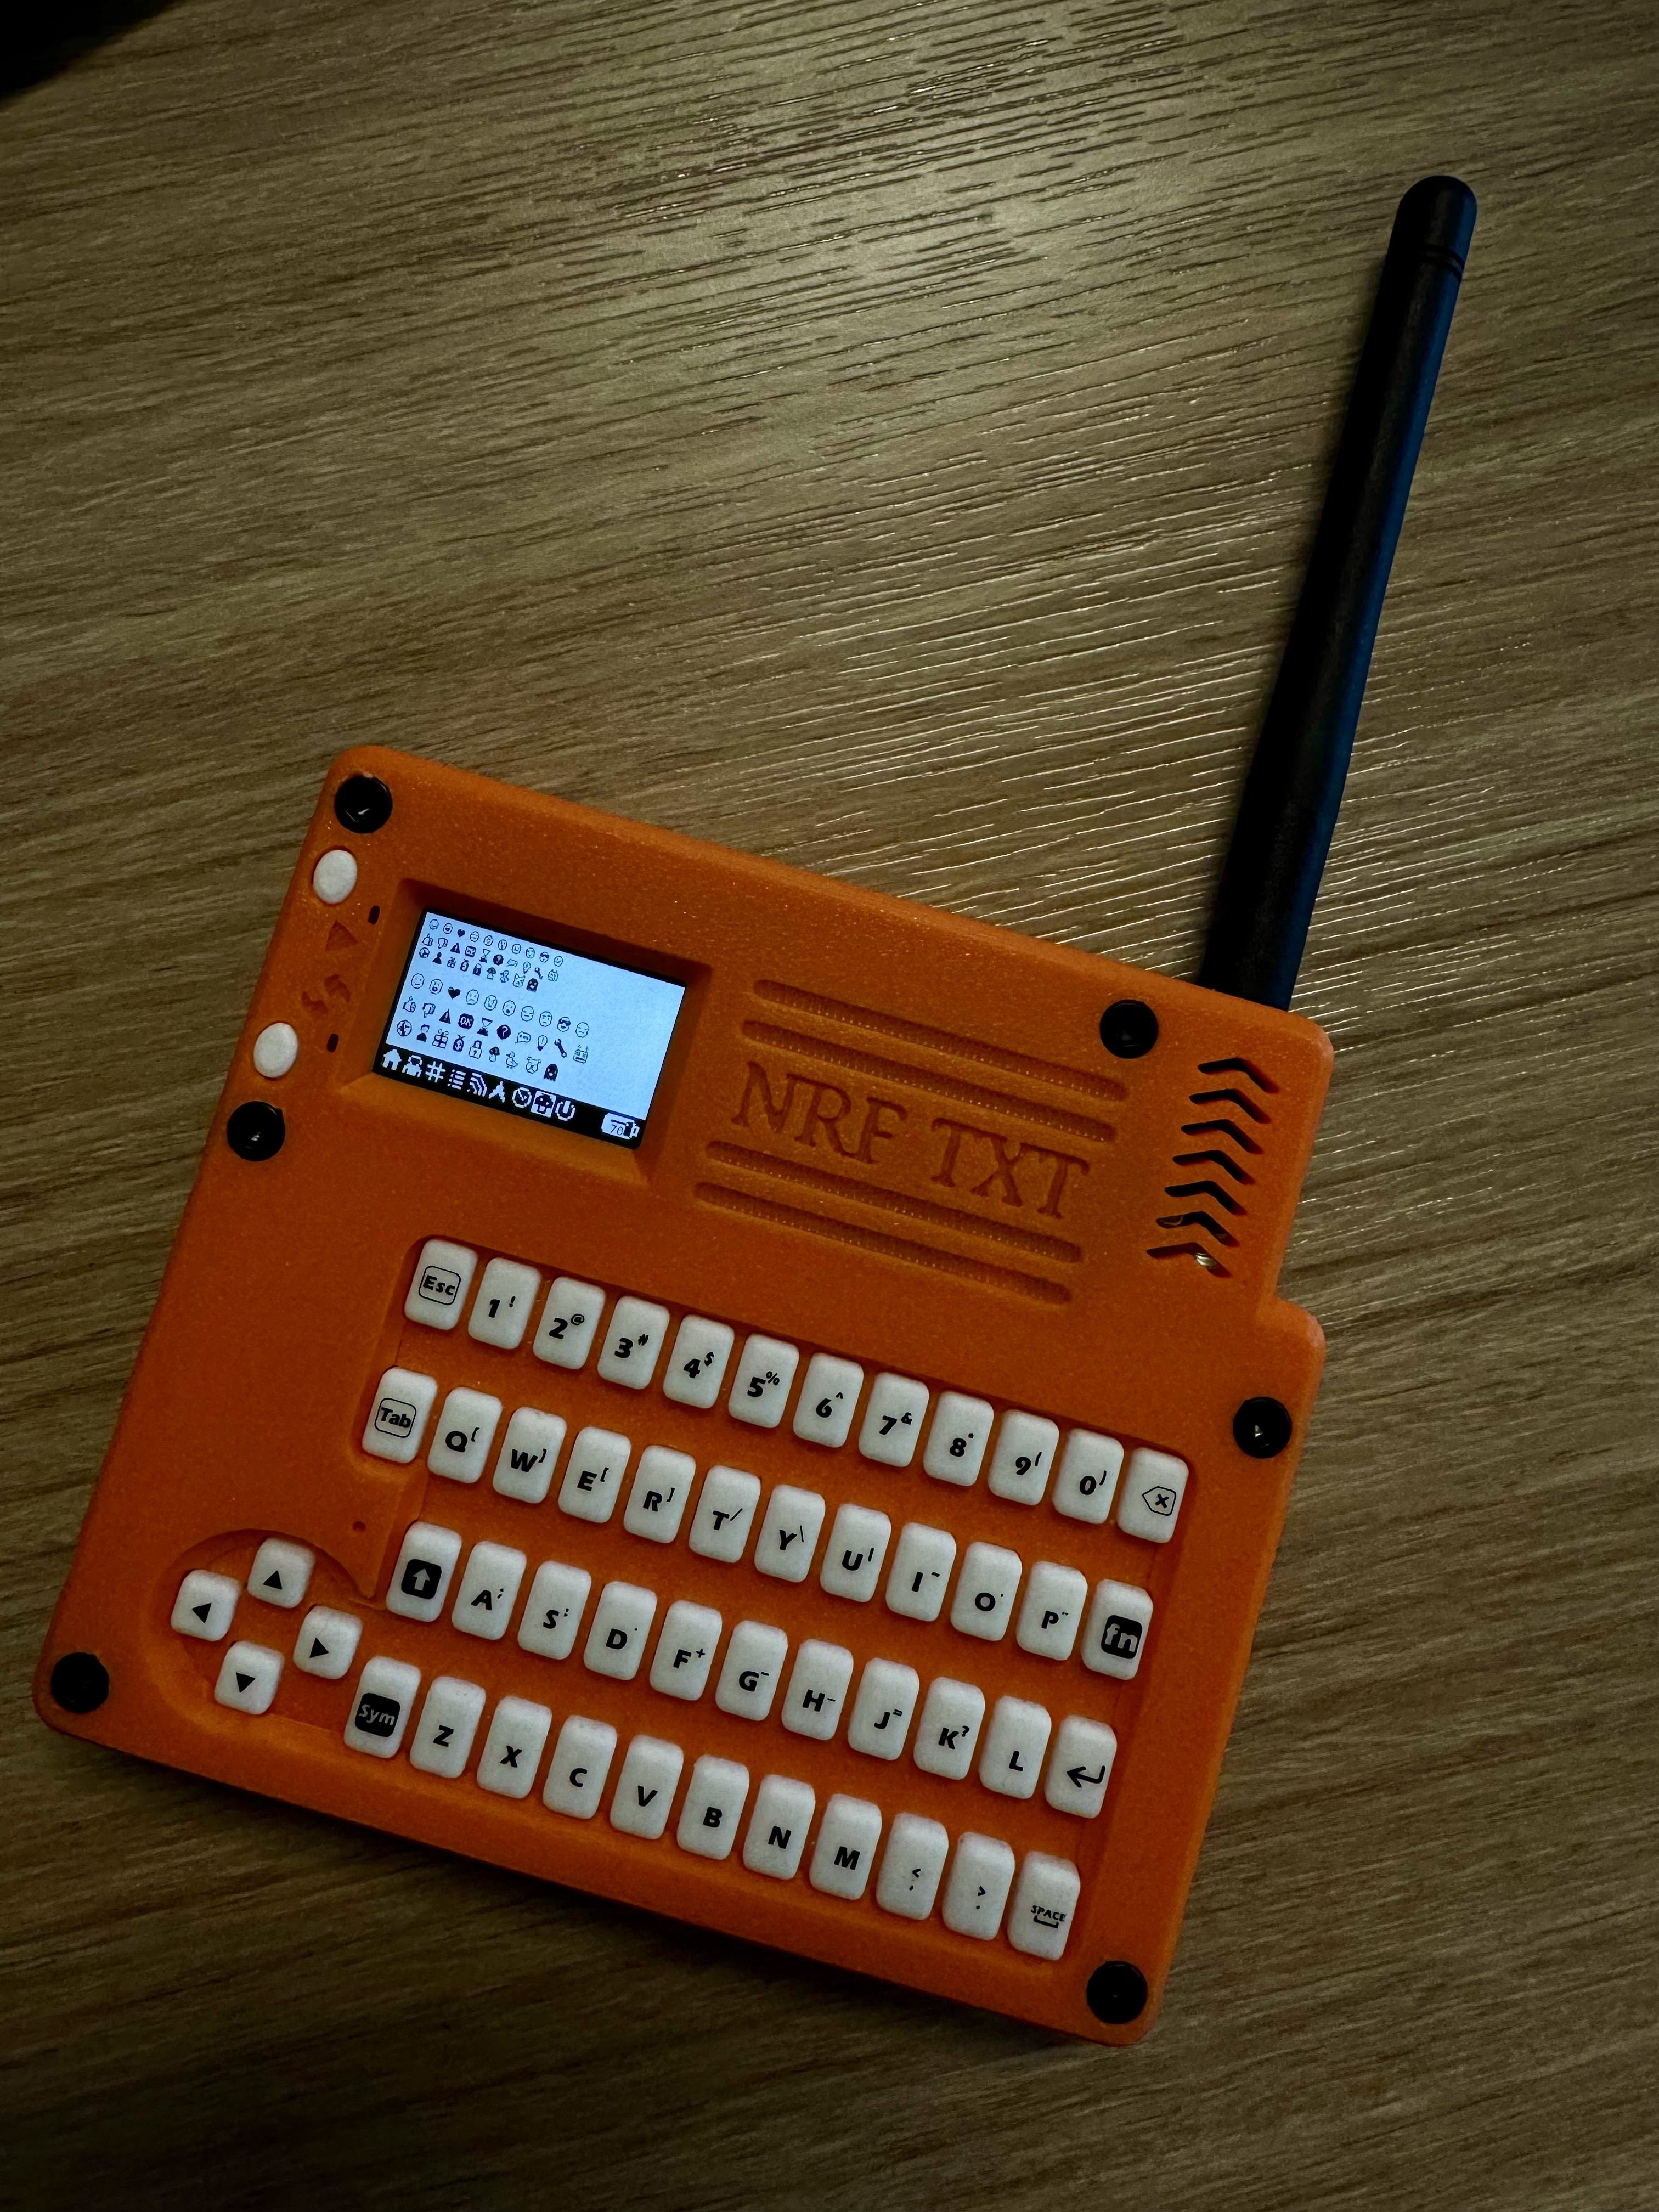
It’s this cute little device that was built for Meshtastic. It’s based on the Heltec T114 radio which is supported by MeshCore, but MeshCore is VERY phone-centric. In order to get this little guy to be a mostly standalone radio, I had to build a custom firmware.
After many hours of coding, vibe coding, drawing little icons, and testing. It’s finally working well enough to be usable-ish.
If you got one of these and want to try it on MeshCore, check out my FW project https://github.com/kallanreed/MeshCore/tree/nrf-txt-fw. I’ve also posted pre-built FW below. Updating the T114 is super easy.
- Connect the device to your computer.
- Double-press the restart button to enter the firmware update mode.
- Drag the uf2 file onto the device.
- Wait until it reboots.
You first need to add contacts and channels with the phone app but then you can send and receive messages using only the device. There are a few hidden UI things that are not intuitive so here’s a cheatsheet.
Global
FN+H: Go to Home screen.FN+I: Toggle screen invert.- Any key: Wake the screen if it is off (the first keypress only wakes the display).
Home Screen Navigation
LEFT: Previous page.RIGHT: Next page.
Lists And Prompts
UP: Move selection up.DOWN: Move selection down.ENTER: Select/confirm.ESCorLEFT: Cancel/close prompt.
Home Page
FN+R: Mark all messages read.ENTER: Open Options prompt (Toggle Buzzer, Toggle Invert).
Recent Adverts Page
UP/DOWN: Select advert.ENTER: Add contact (opens Add/Cancel prompt).
Contacts Page
UP/DOWN: Select contact.ENTER: Open contact thread.
Channels Page
UP/DOWN: Select channel.ENTER: Open channel thread.
Thread Screen (Contact Or Channel)
ESCorLEFT: Return to Home.FN+ENTER: Compose message (opens text input).FN+R: Mark thread messages read.ENTER: Open selected message in viewer.UP/DOWN: Move through message list.
Message Viewer
ESCorLEFTorENTER: Return to previous screen.UP: Previous message.DOWN: Next message.
Text Input
ESC: Cancel and return.LEFT/RIGHT: Move cursor.ENTER: Send/accept input.BACKSPACEorDEL: Delete character before cursor.
Radio Page
ENTER: Open Radio Options prompt (Reset Stats, Toggle BLE, Advert: Zero Hop, Advert: Flood, Toggle Camp Mode).- Camp Mode is “Client Repeater” mode.
GPS Page
ENTER: Open GPS Sensor prompt (Enable, Disable).
Power Page
ENTER: Open Shutdown prompt (Yes, No).